How to set up debugging with PhpStorm and Homestead
Daniel Verner -
Many PHP developers rely on var_dump (or it’s reincarnations in frameworks: debug(), dump(), dd(), etc) when debugging their code, and in most cases, this is just fine, but not always good enough. When trying to solve complex problems or fix a stubborn bug, the great debugging capability of PhpStorm comes handy. It is quicker and more efficient to debug the code than to put dumps here and there.
Let’s take a look at what is necessary to set up the debugging:
PhpStorm
Homestead (or any other Vagrant VM)
Xdebug extension
In the code examples please change paths according to your PHP version, I am using PHP 7.2.
Set up Xdebug
If you don’t have xdebug installed please find installation instructions here: https://xdebug.org/docs/install Open the Xdebug configuration with your favorite editor, in the example I’ll use nano:
sudo nano /etc/php/7.2/fpm/conf.d/20-xdebug.ini
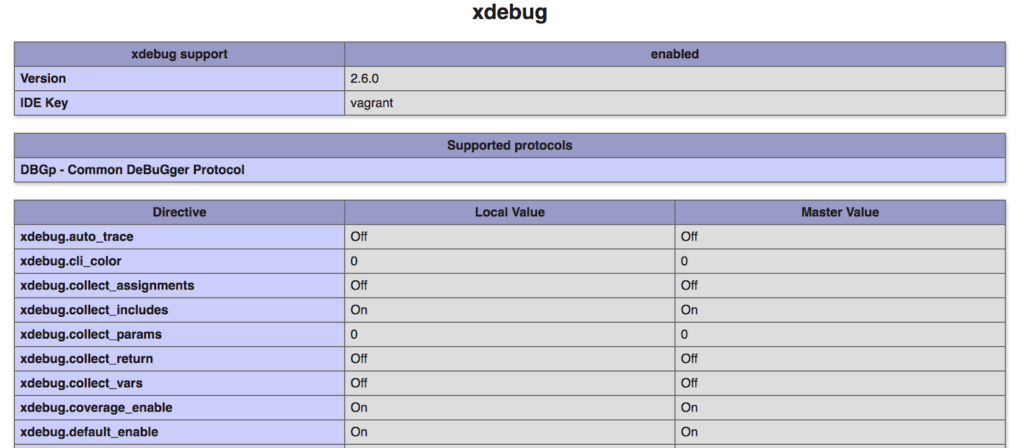
Add/change the following settings in the xdebug configuration
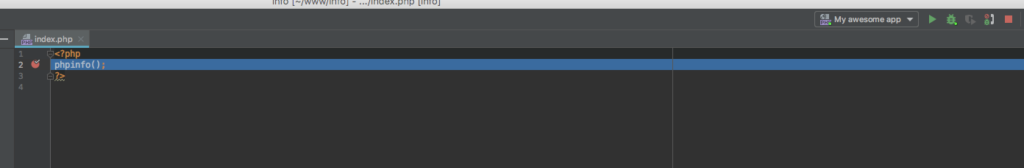
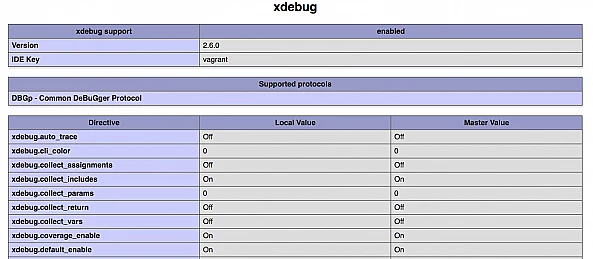
If everything has been set up correctly, you should see the Xdebug extension installed and enabled in the output of the phpinfo():
Set up PhpStorm
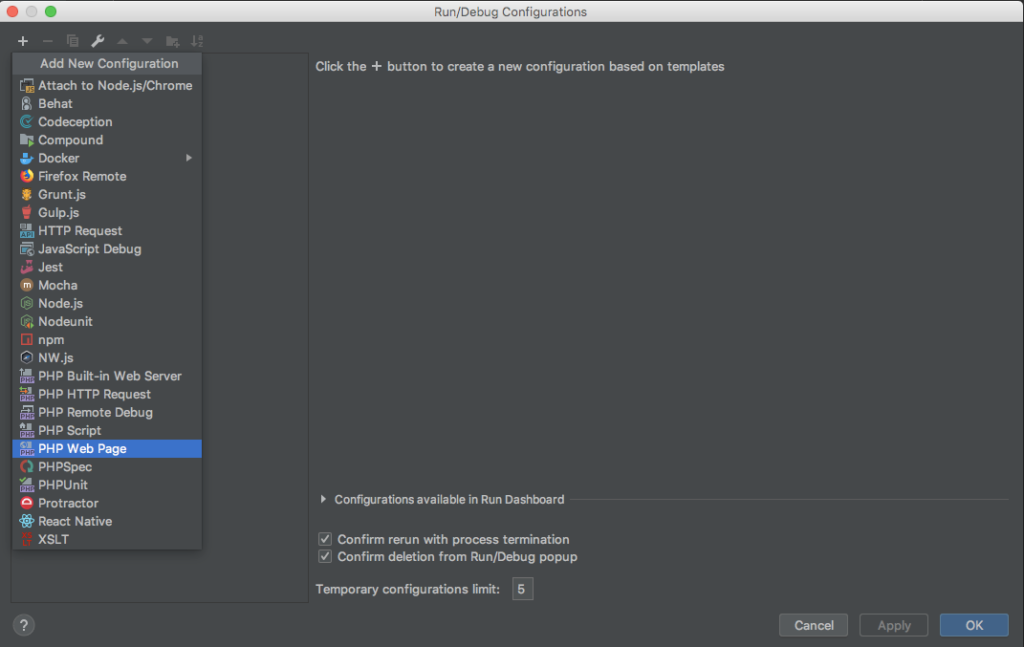
In the menu choose Run/Edit Configurations, and add new PHP Web Page configuration:
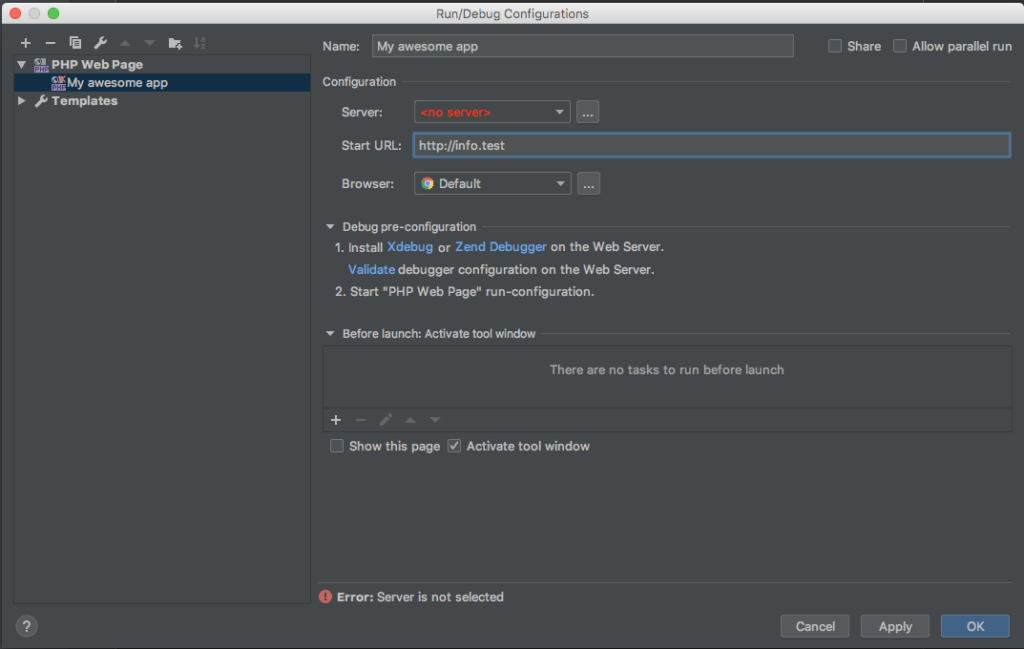
Add a name to the configuration, and fill in the Start url and choose the browser and server from the dropdown options:
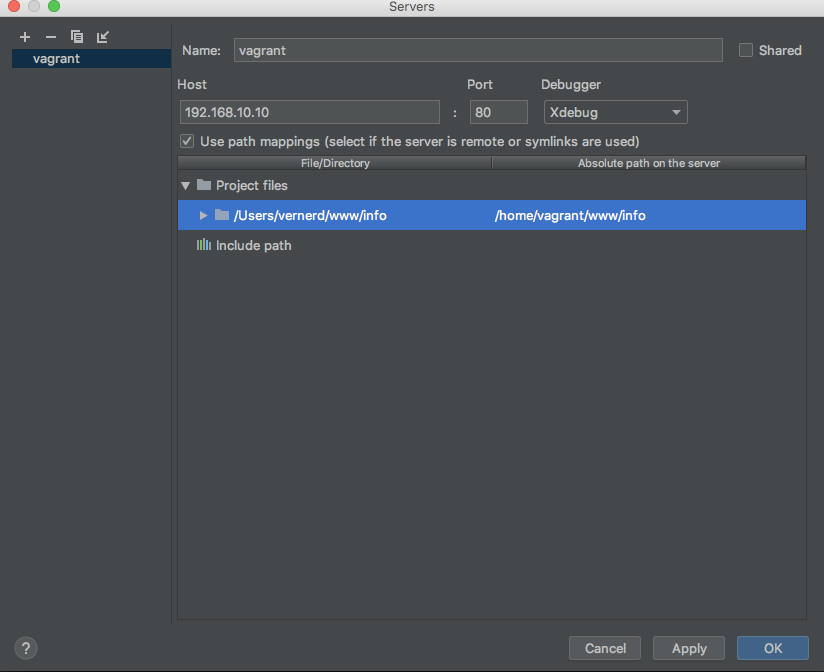
If the server dropdown is empty you’d need to add a new server. The if you are using the default Vagrant configuration the ip address of the server is: 192.168.10.10. Check the Use path mapping checkbox, and set up the Absolute path of the project in the Homestead, the default location in homestead is /home/vagrant/code/project (I am using www instead of code)
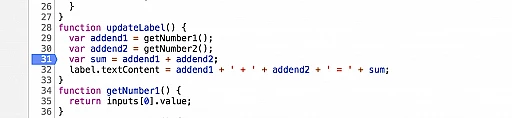
That’s it! Clicking on the debug icon on the top right corner, the browser will open the project’s URL and the debug session will start. You can put breakpoints by clicking on the left-hand side of the code beside the line numbers: